Application Name | Network Formation Assay |
Version | 2.0.0 |
Documentation Version | 21.03.2022 - 1 |
Input Image(s) | 2D (standard and/or WSI) / Time Series / z-Stack / Multichannel Images; RGB or Grayscale (8 bit) |
Input Parameter(s) | Regions of interest (optional) |
Keywords | network, tube, formation, in-vitro, angiogenesis, vessel, growth, microscopy, matrigel |
Short Description | Detection of branching points, loops, and cell coverage in network formation assay used for in-vitro angiogenesis research. |
References / Literature | For more information regarding the assay check e.g. https://www.ncbi.nlm.nih.gov/pmc/articles/PMC3230200/; Reference laboratory: Department of Obstetrics and Gynecology: Dr. Ursula Hiden; Jasmin Strutz, MSc; |
Table of contents
| Table of Contents | ||||||
|---|---|---|---|---|---|---|
|
IKOSA Prisma Network Formation Assay
You can use this image analysis application or any of our other applications in your account on the IKOSA platform. If it is not on the list of available applications, please contact your organization's administrator or our team at support@kmlvision.com.
Application description
This application automatically segments the network created by cells in a 2D network (tube) formation assay, typically on an extracellular matrix such as provided as the growth-factor reduced Matrigel® assay, and extracts relevant measures (loops, branching points, covered area).
In the following sections, we provide the necessary input data requirements that are necessary to obtain accurate image analysis results and a description of the output files.
Sample data
To try out this application, sample images can be downloaded here: https://drive.google.com/open?id=1WnUnZr4gbXp6-vpEvPfIa8yBgW_Ko3-P.
Input data requirements
Input image(s)
Input for this application is the following image data:
Image type | Color channels | Color depth (per channel) | Size (px) | Resolution (μm/px) |
|---|---|---|---|---|
2D (standard and/or WSI), Time Series, Multichannel, Z-stack* Check image format File formats | 1 (Greyscale) 3 (RGB) | 8 Bit | Standard and WSI: Min: 256 x 256 | typically: 1.75 |
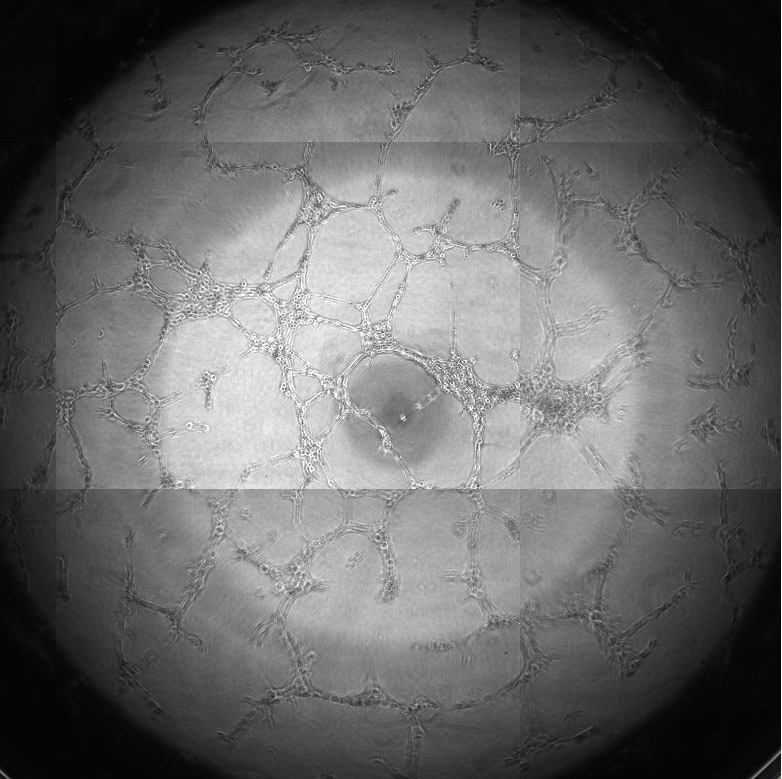
Image content Microscopy image of 2D network (“tube”) formation assay, typically taken with 4x magnification. Additional requirements: None | ||||
| Info |
|---|
*Please note: Z-stack images cannot be uploaded into IKOSA but still can be analyzed via IKOSA Prisma API. |
| Note |
|---|
Important: For all images, the following requirements apply:
|
Input parameter(s)
No additional input parameters are required for this application.
As an optional parameter, a single or multiple regions of interest (ROIs) can be defined in which the analysis should be performed (‘inclusion ROIs’).
Description of output files and their content
Files
File format | Description | |||
|---|---|---|---|---|
| 1 | csv | results.csv: A csv file containing statistics about input image. | ||
| 2 | csv | results_01_loops.csv: A csv file containing statistics about detected loops. | ||
| 3 | jpg | results_vis/vis.jpg (2D image, no ROI), or results_vis/t<time-step>.jpg (time step <time-step> of time series, no ROI),or results_vis/<roi-id>.jpg(2D image, ROI <roi-id>),or results_vis/t<time-step>_<roi-id>.jpg (time step <time-step> of time series, ROI <roi-id>): A visualization of the analysis result for a specific time step for either the whole image (if no inclusion ROIs selected for analysis) or each individual inclusion ROI:
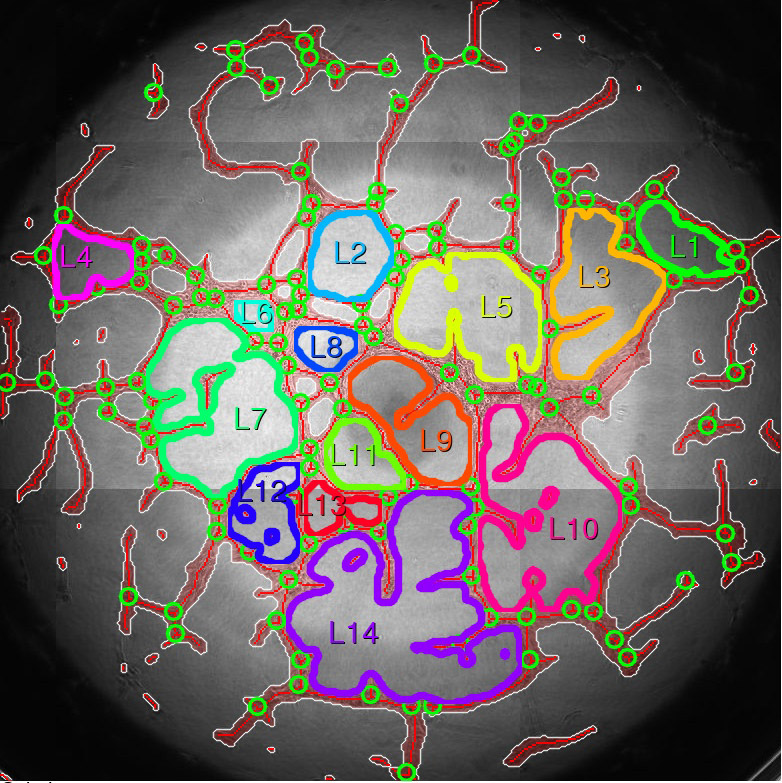  Reference: Dr. Ursula Hiden, Department of Obstetrics and Gynecology, Medical University of Graz; Jasmin Strutz, MSc, Department of Obstetrics and Gynecology, Medical University of Graz
| ||
| 4 | json | roiMeta.json: A json file containing all information regarding the ROIs defined for the analysis job to ensure reproducibility. The file is empty if no ROIs were defined for analysis. | ||
| 5 | jpg | rois_visualization.jpg, or t<time-step>_z<z-layer>_c<channel>_rois_visualization.jpg: An overview visualization to show locations of all analyzed ROIs for the 2D image or time step <time-step> of a time series, z-layer <z-layer> of a z-stack, or channel <channel> of a multichannel image.
| ||
| 6 | json | jobResultBundleMeta.json: A json file containing all information regarding the analysis job (application name and version, project, etc.) to ensure reproducibility.
|
| Info |
|---|
Please note:
|
Content
results.csv
Single csv-file
Column NO. | Column name | Examples | Value range | Description |
|---|---|---|---|---|
1 | t | 3 | 1 - | Time step, i.e. the position of the image in the time series. |
2 | z | 5 | 1 - | z-layer, i.e. the position of the layer in the z-stack. |
3 | c | 2 | 1 - | Channel, i.e. the position of the channel in the multichannel image. |
4 | roi_id | ROI-03 | ROI-01 - | <roi-id> starting from “ROI-01”. Empty, if no inclusion ROI is specified and the whole image was analyzed. |
5 | roi_name | “central” | text | Custom text to identify the ROI. Empty, if no inclusion ROI is specified and the whole image was analyzed. |
6 | roi_size [Px^2] | 1212212 | 1 - | Size of the ROI that was analyzed in pixels^2. The size of the whole image is given if no inclusion ROI is specified and the whole image was analyzed. |
7 | branching points | 104 | 0 - | Number of detected branching points. |
8 | covered area [Px^2] | 93869 | 0 - # of pixels in image | Total area covered by cells or tubes in pixels. |
9 | num_tubes | 190 | 0 - | Number of Tubes detected. |
10 | Total_tube_length [Px] | 6641.4 | 0 - # of pixels in image | Total length of all tubes in pixels. |
results_01_loops.csv
Single csv-file
Column NO. | Column name | Examples | Value range | Description |
|---|---|---|---|---|
1 | t | 3 | 1 - | Time step, i.e. the position of the image in the time series. |
2 | z | 5 | 1 - | z-layer, i.e. the position of the layer in the z-stack. |
3 | c | 2 | 1 - | Channel, i.e. the position of the channel in the multichannel image. |
4 | roi_id | ROI-03 | ROI-01 - | <roi-id> starting from “ROI-01”. Empty, if no inclusion ROI is specified and the whole image was analyzed. |
5 | roi_name | “central” | text | Custom text to identify the ROI. Empty, if no inclusion ROI is specified and the whole image was analyzed. |
6 | roi_size [Px^2] | 1212212 | 1 - | Size of the ROI that was analyzed in pixels^2. The size of the whole image is given if no inclusion ROI is specified and the whole image was analyzed. |
7 | object_id | 1 | 1 - | Loop id. |
8 | Area [Px^2] | 10747 | 201 - # of pixels in image | Area of the loop in pixels. |
9 | Perimeter [Px] | 452.3 | 0 - | Perimeter of loop in pixels. |
| Info |
|---|
Please note: The parameters marked with an asterisk (*) are calculated using https://scikit-image.org/. |
Error information
More information about errors can be found in the Application Error Documentation.
Contact
If you have any questions about this app, as well as suggestions or ideas for new ones, email us at support@kmlvision.com.
Feel free to book a 30-minute meeting to speak with us about IKOSA and the apps!