Improve your understanding of qualitative instance segmentation results to gain contextual insights from your output data.
With the help of your qualitative results output, you can compare the predictions of your application with your manual (ground truth) annotations. This can help you better assess the predictive power of your trained model.
What to expect from this page?
| Table of Contents | ||||||
|---|---|---|---|---|---|---|
|
📑 Location of qualitative output visualizations
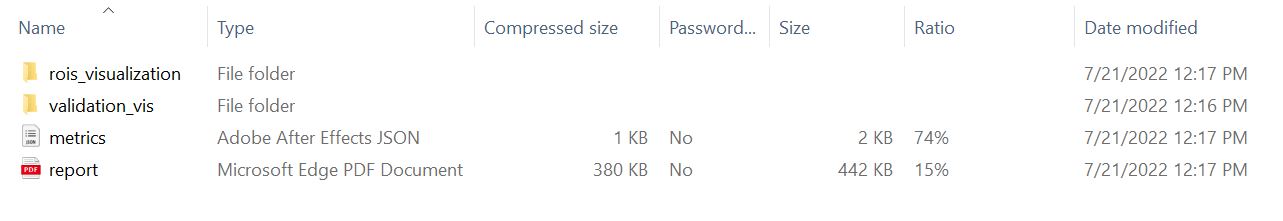
Qualitative results for all validation images and ROI(s) are provided in a ZIP-folder in the form of visualizations in separate image files in addition to the PDF report.
📑 Types of visualizations included
ROI(s) overview
If you have included ROI(s) in your validation images, an overview with a visualization of the ROI(s)' position(s) within the image will be provided.
You can find it in the folder rois_visualizations: [your-image-name]_rois_visualization.jpg.
| Info |
|---|
Please note:
|
Image and ROI Performance
You will also find validation visualizations showing the performance of your trained model for a specific label [your-label-name] within the image or the ROI. They are located in the validation_vis folder. This folder also includes confidence visualizations for each instance.
The image and ROI files are named accordingly:
[your-label-name][your-image-name].jpg - visualization name of an image that contains no ROI(s)
[your-label-name][your-image-name]_[roi-id].jpg - visualization name of a ROI
📑 Understanding performance visualizations
Each of the validation visualizations is divided into four sections:
(1) Input image
(2) Instance correctness, prediction
(3) Instance correctness, annotation
| Info |
|---|
Please note: that all visualizations are downscaled to 25 megapixels (MP), if the visualization in the original image size is larger than 25 MP. |
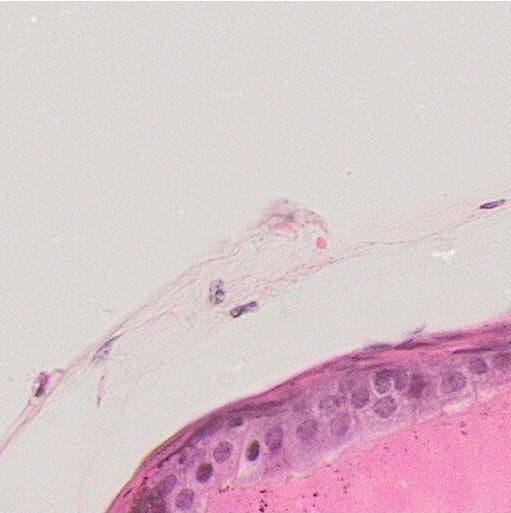
Input image
(Left upper image)
Shows the input image.
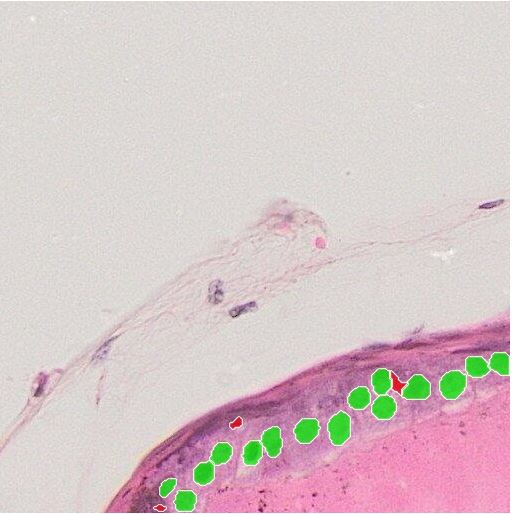
Instance correctness, prediction [label-name]
(Right upper image)
Shows an overlay of predicted instances (instance contours) as predicted by the application, marked with a different color (e.g. as true-positives or as false-positives) depending on the presence of an overlap.
True-positive areas (overlap ≥ 50%) are shown in
| Status | ||||
|---|---|---|---|---|
|
Instances predicted by the application that match annotated instances with an overlap of ≥ 50%. In other words, these instances have been predicted correctly.
False-positive areas (overlap < 50%) are shown in
| Status | ||||
|---|---|---|---|---|
|
Instances that have not been annotated, but have been predicted by your application.
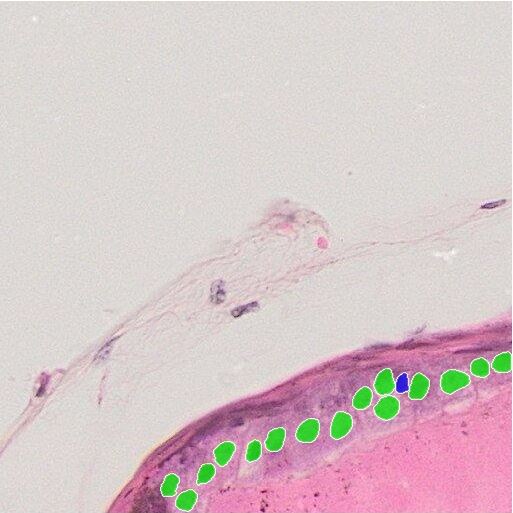
Instance correctness, annotation [label-name]
(Left lower image)
Shows an overlay of ground-truth instances as drawn by the user, marked with a different color (e.g. as true-positives or as false-negatives) depending on the presence of an overlap.
True-positive areas (overlap ≥ 50%) are shown in
| Status | ||||
|---|---|---|---|---|
|
Annotated instances that match instances predicted by the application with an overlap of ≥ 50%. In other words, the app detects and labels these objects in the images correctly.
False-negative areas (overlap < 50%) are shown in
| Status | ||||
|---|---|---|---|---|
|
Instances that have been annotated, but not predicted by your application.
Pixel correctness [label-name]
(Right lower image)
Visualizes correctness cases resulting from the automated prediction (compared to manual annotations) shown on a pixel level.
True-positive areas (overlap ≥ 50%) are shown displayed in
| Status | ||||
|---|---|---|---|---|
|
Areas where the prediction of the application matches annotations, represent the ground truth for the applicationyour app's prediction matches your annotations. In other words, it labels areas of the image correctlythe predicted labelled area overlaps with annotation by more than 50%.
False-positive areas (overlap < 50%) are shown displayed in
| Status | ||||
|---|---|---|---|---|
|
Areas that have not been annotated, however, were yet predicted by your appthe application. In other words, it predicts and labels parts areas of the image that should not be predicted and labeled. Areas falling into this category either do not match annotation or do so by less than 50%.
False-negative areas (overlap < 50%) are shown displayed in
| Status | ||||
|---|---|---|---|---|
|
Areas that have been annotated, however, were yet not predicted and labeled by your application.
Now that you have mastered the handling of qualitative results, you are perfectly equipped to gain solid insights from your analysis outputs.
If you still have questions regarding your application training, feel free to send us an email at support@ikosa.ai. Copy-paste your training ID in the subject line of your email.
📚 Related articles
| Filter by label (Content by label) | ||||||
|---|---|---|---|---|---|---|
|